使用 docker-compose 搭建 prometheus 监控系统
Prometheus 是当前一套非常流行的开源监控和报警系统,于 2016 年加入了 Clound Native Computing Foundation,是继 kubernates 之后的第二个托管项目。
本文讲述如何使用 docker 快速搭建 prometheus 监控系统。
概览
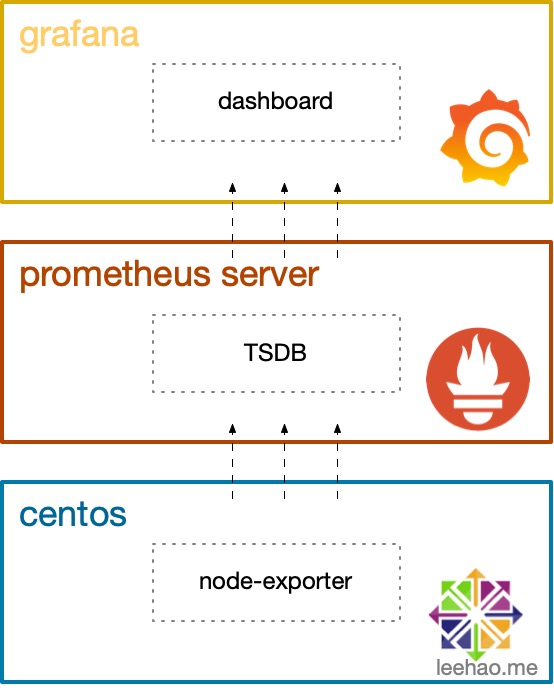
本文的实验环境为 Mac OS,监控系统主要是用来监控两台 CentOS 主机资源使用情况。搭建的监控系统包括以下软件:
- prometheus:负责收集和存储时间序列数据
- node-exporter:负责暴露主机 metrics 数据给 prometheus
- grafana:负责展示数据
它们的关系如下图所示:
node-exporter
为方便操作,我们先创建 prometheus 目录,用于存放此次实验的文件,例如,笔者创建的目录为 ~/code/docker/prometheus。
Node-exporter (下文简称 exporter)官方文档不建议使用 docker 来安装 exporter,本文为了实验的便捷,通过在一个 centos 容器运行 exporter 来验证其使用方法。
生产环境下,可以直接在主机上安装 exporter。
从链接 https://prometheus.io/download/#node_exporter 下载 exporter,解压,文件夹改名为 node_exporter ,并放置在 prometheus 目录下。
为使用 docker 运行 exporter,需要安装好 docker 和 docker-compose。
运行 exporter 的 docker-compose.yml 文件如下:
1 | version: '3' |
启动两个 centos 容器,每个容器都运行 exporter,用于生成 prometheus 所需要主机 metrics。
exporter 启动的默认端口是 9100,为了在外部访问,我们将其分别映射为 9101 和 9102 端口。
为了在 centos 容器内部执行 exporter,我们使用 bind mount 的方式,并使用 command 来执行 exporter。
执行 docker-compose up -d ,成功启动容器 centos1 和 centos2 ,打开浏览器,输入地址 http://127.0.0.1:9101/metrics 和 http://127.0.0.1:9102/metrics 可以看到 metrics 输出。

prometheus
在 prometheus 目录下创建 prometheus 目录,用于存放 prometheus 的配置文件 prometheus.yml。创建 prometheus.yml 文件如下:
1 | global: |
global 是全局的配置,scrape_interval 用于设置每次数据收集的间隔为 5 秒。scrape_configs 用于配置数据收集的信息,这里我们配置了两个 job,一个用于收集 prometheus 自身的 metrics,一个用于收集上面我们启动的两个 centos 容器的 metrics。
在配置 targets 地址时,我们需要使用 docker-compose.yml 中容器名称来代替相应的 ip 地址,这种使用方式也在文章《Docker Compose 入门教程》中使用过。
添加上 prometheus 的 docker-compose.yml 文件如下:
1 | version: '3' |
为了退出容器后可以保存数据,我们使用了 bind mount 的方式,将 prometheus 保存 TSDB 目录映射到本地的 prometheus_data 目录。
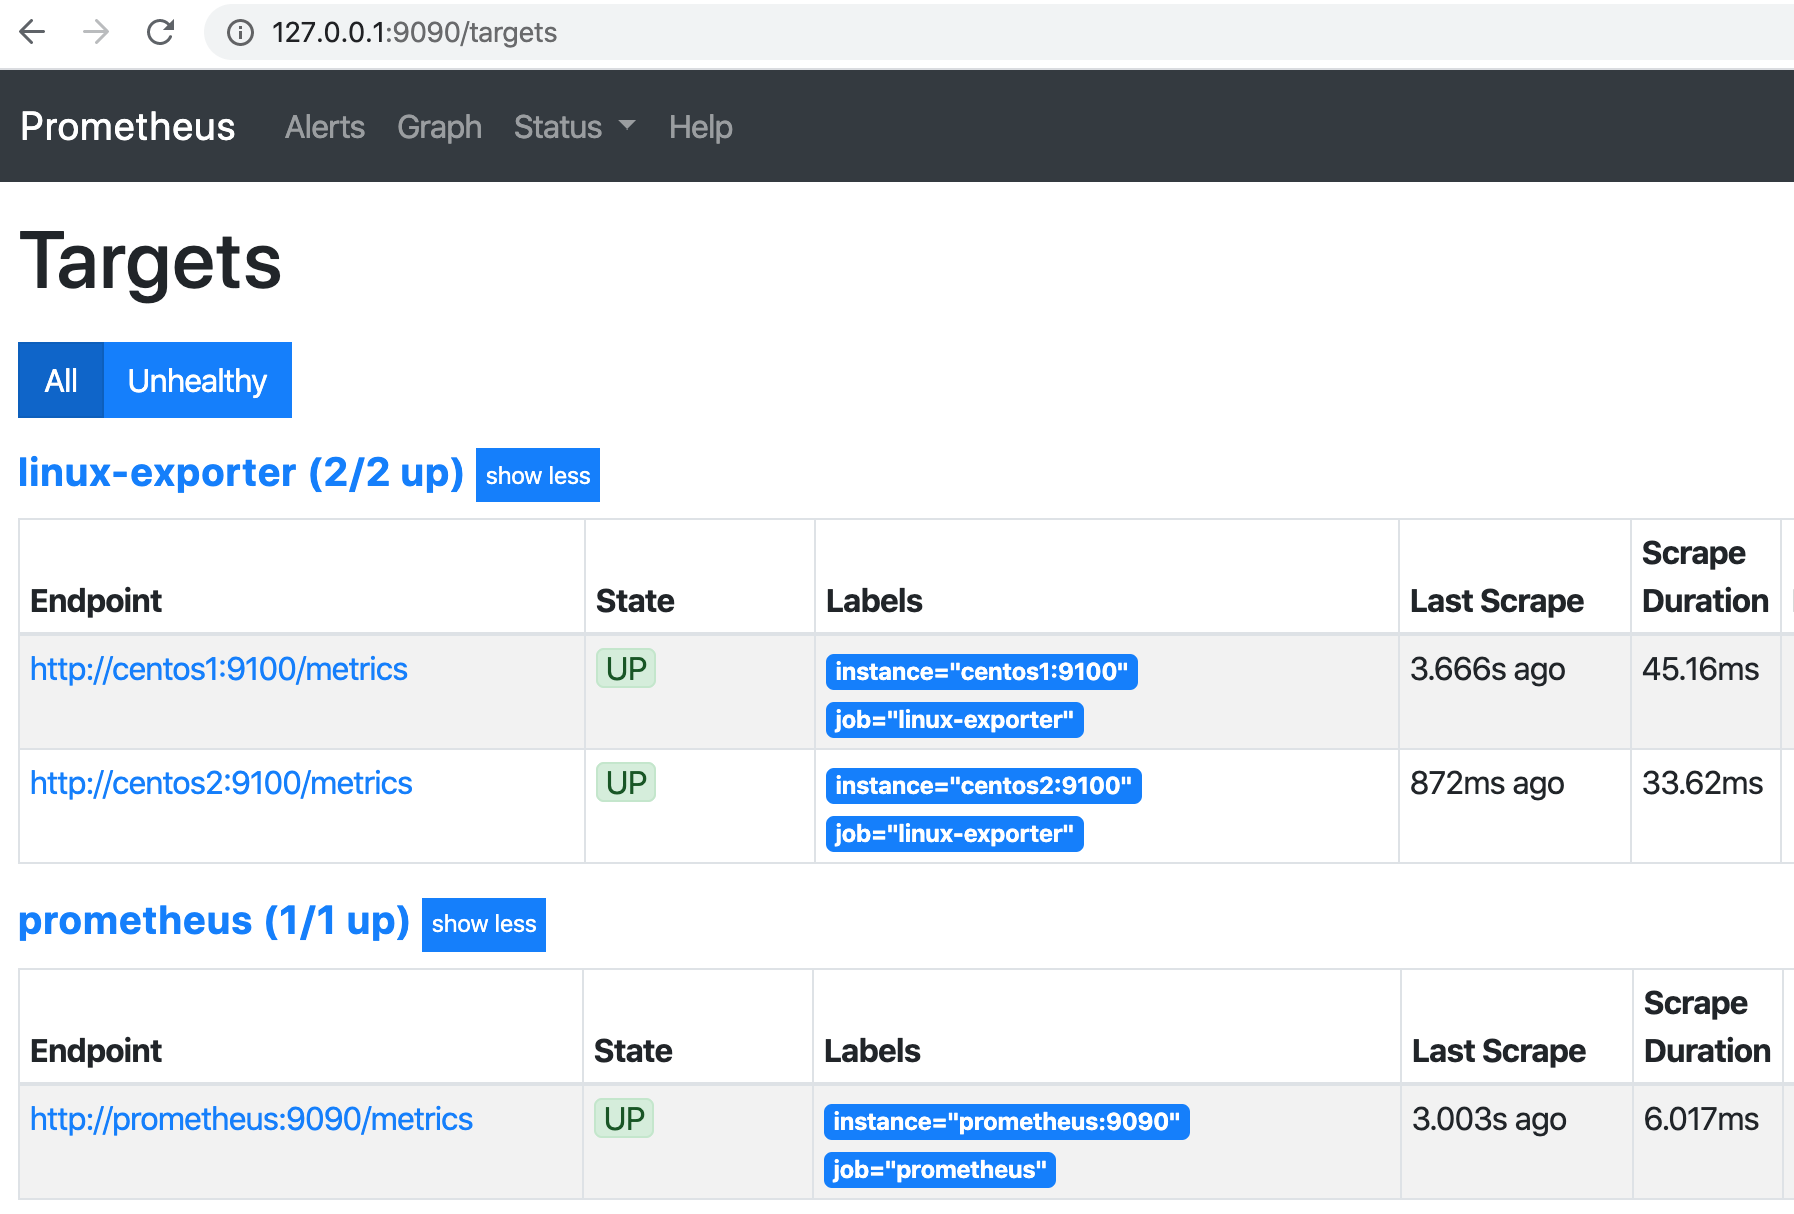
执行 docker-compose up -d 后,打开浏览器,输入地址 http://127.0.0.1:9090/targets ,可以看到 两个 centos 容器 targets 的状态都为 UP 状态,说明 prometheus 可以正常获取 exporter 的数据。
grafana
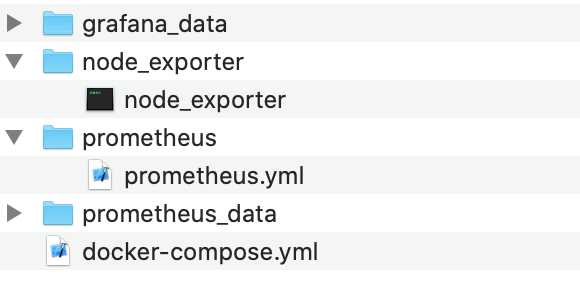
在 prometheus 目录下创建 grafana_data 目录,用于保存 grafana 的数据。本实验完整的 prometheus 目录结构如下图所示:
添加上 grafana 的 docker-compose.yml 文件如下:
1 | version: '3' |
启动 docker-compose 后,打开浏览器,输入地址 http://127.0.0.1:3000 ,输入用户名 admin 和密码 admin,登录进 grafana。
我们先添加 data source:
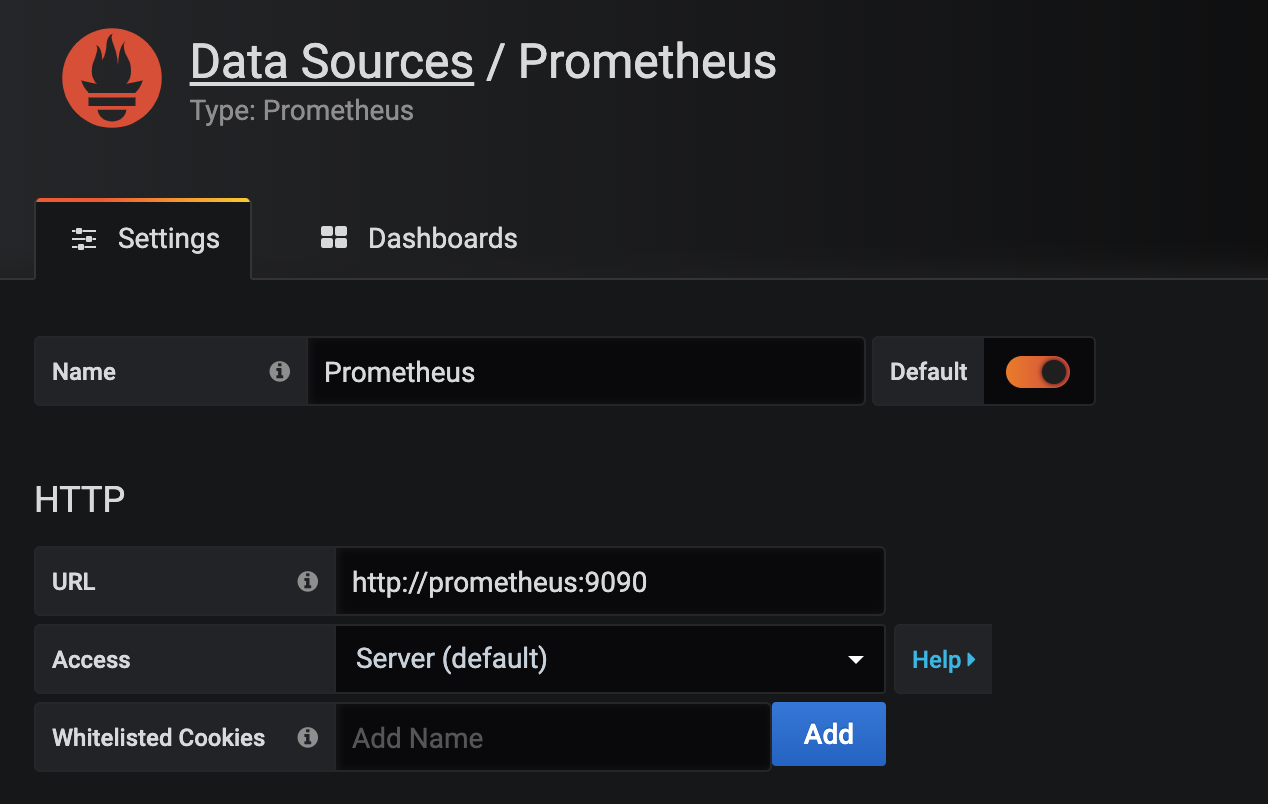
注意输入的 prometheus 地址为 http://prometheus:9090。
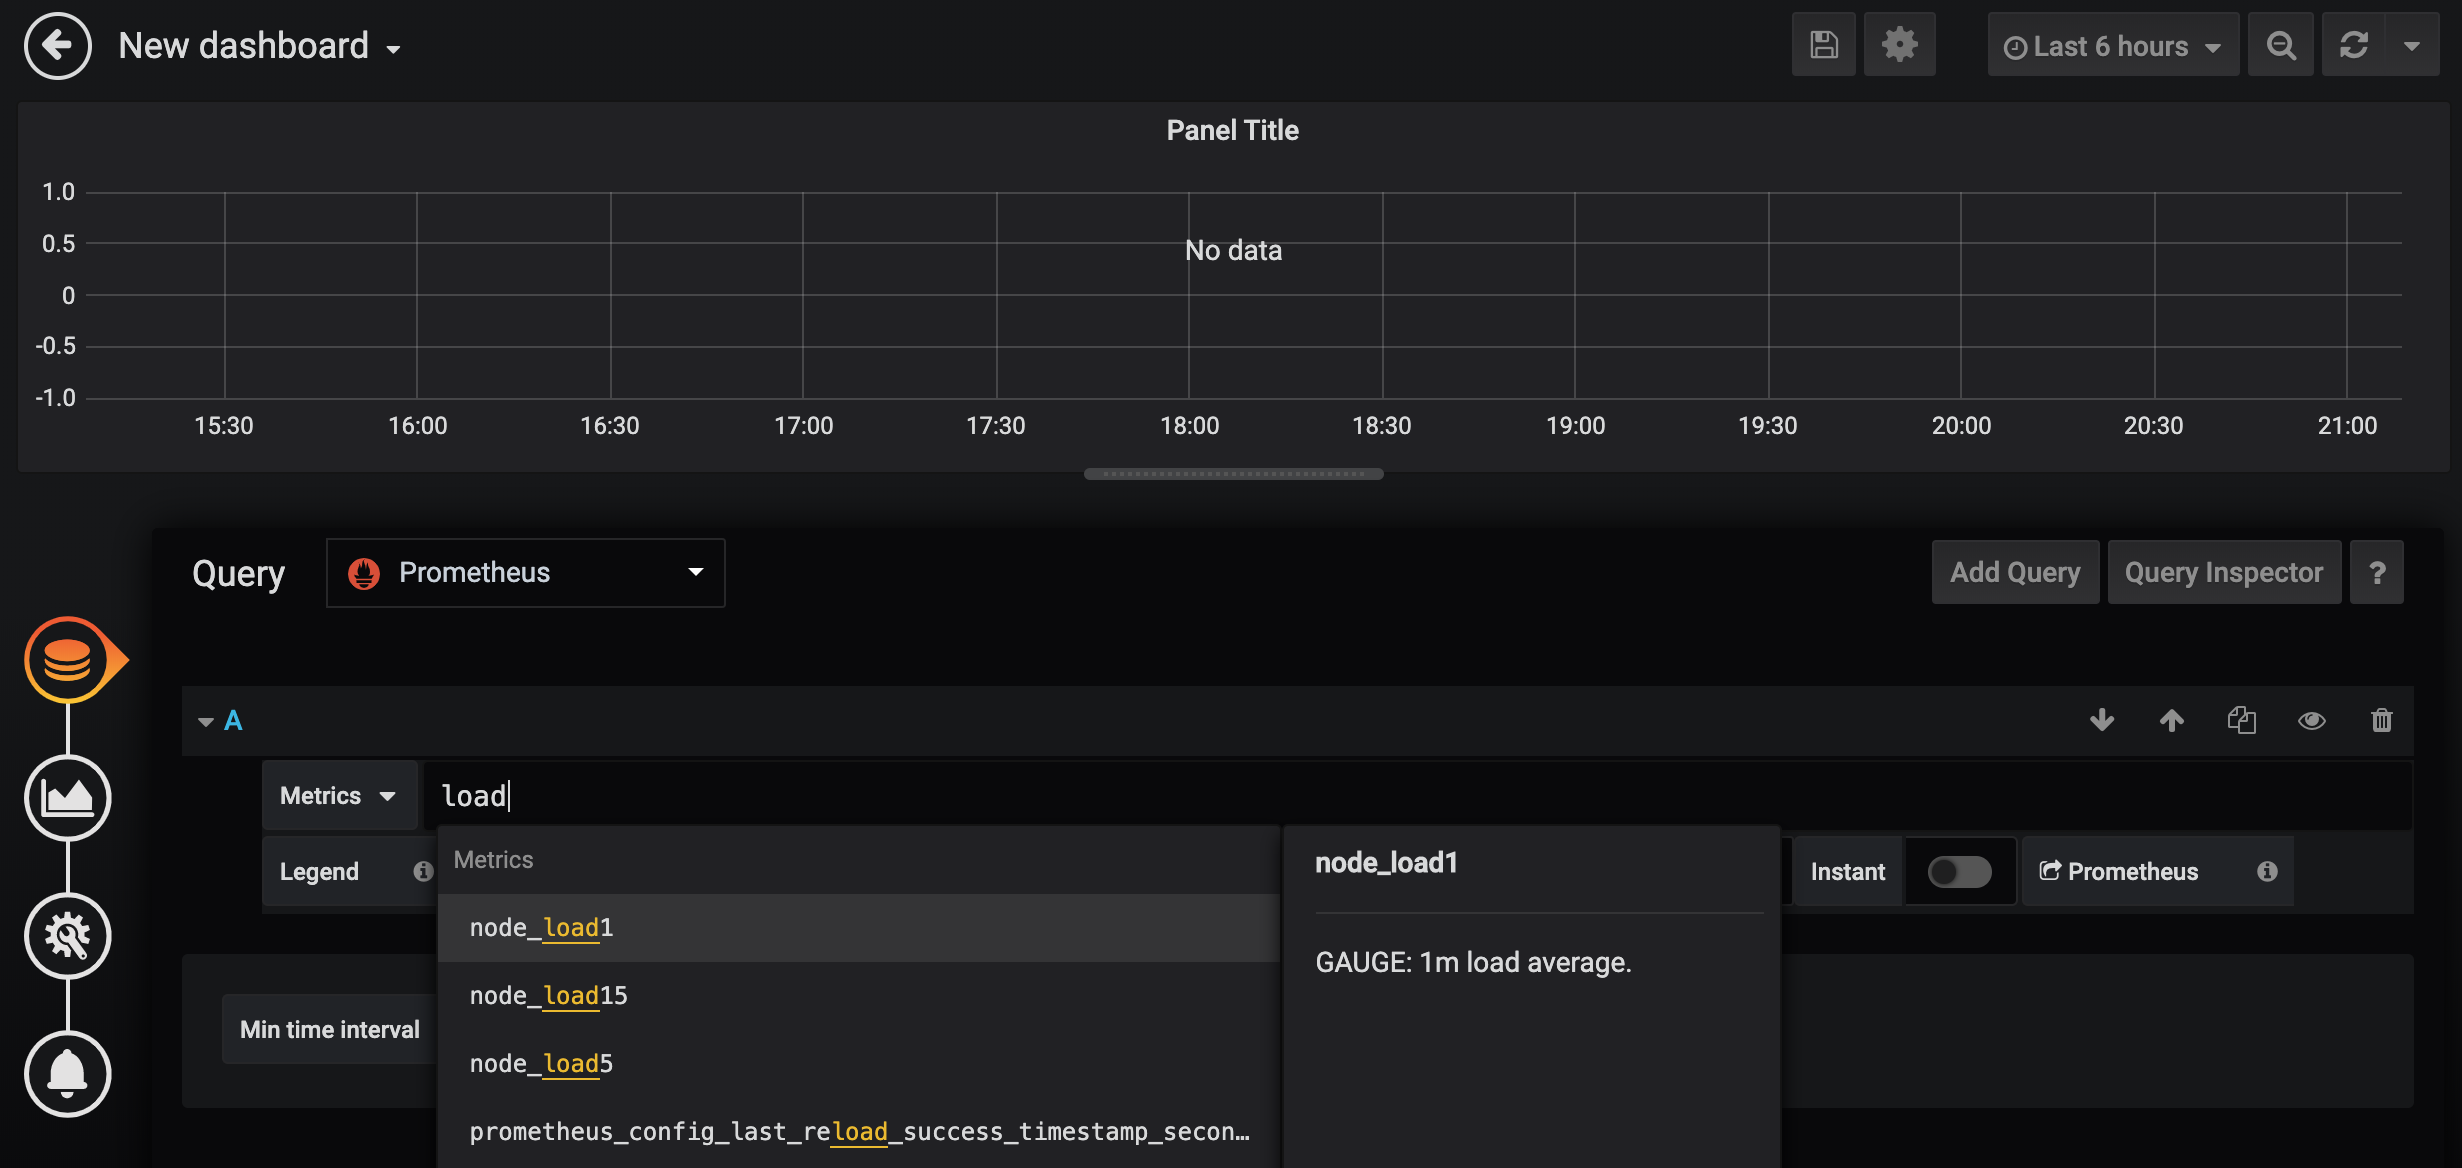
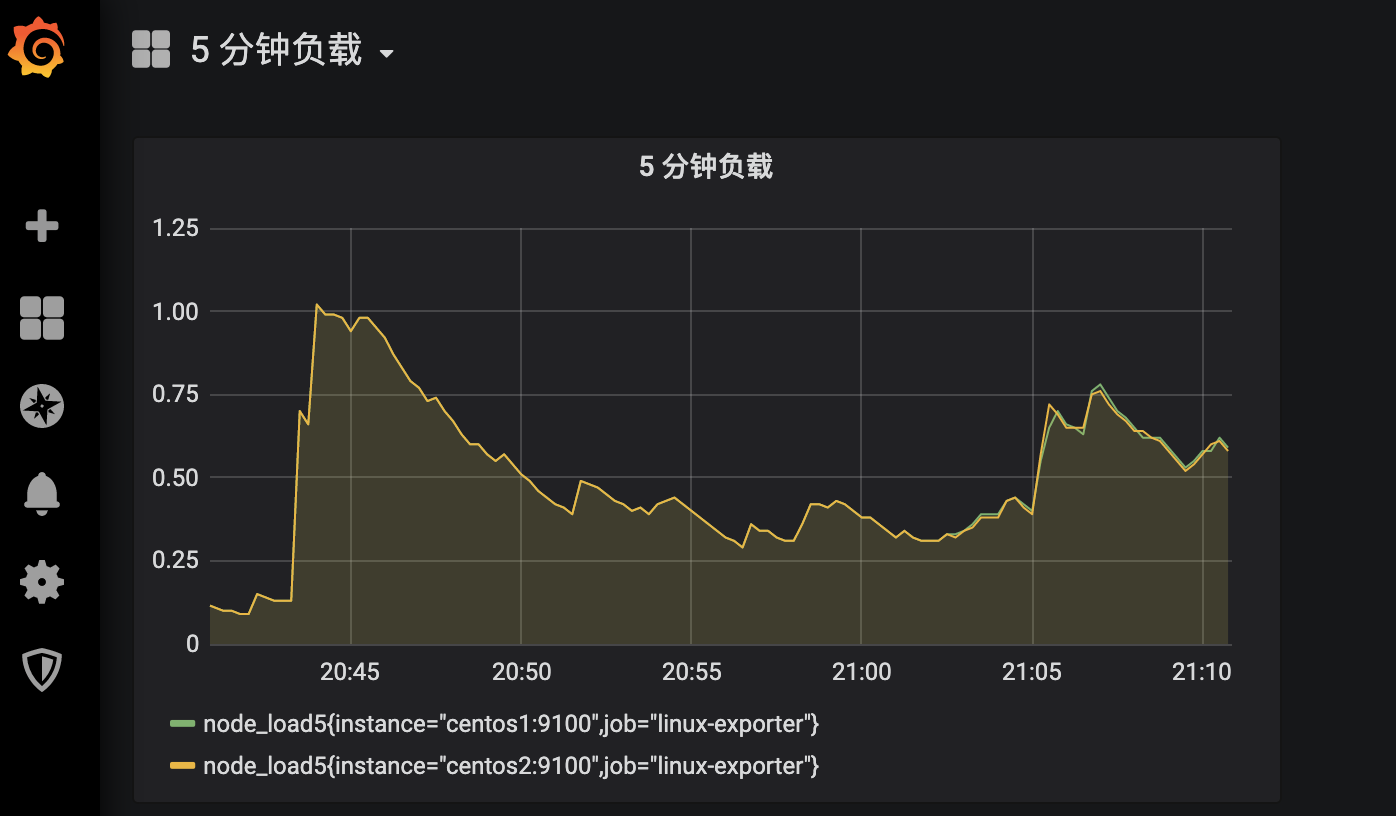
接下来可以创建新的 dashboard,例如,我们创建一个显示5 分钟内负载的 dashboard:
编辑完成,保存,显示效果:
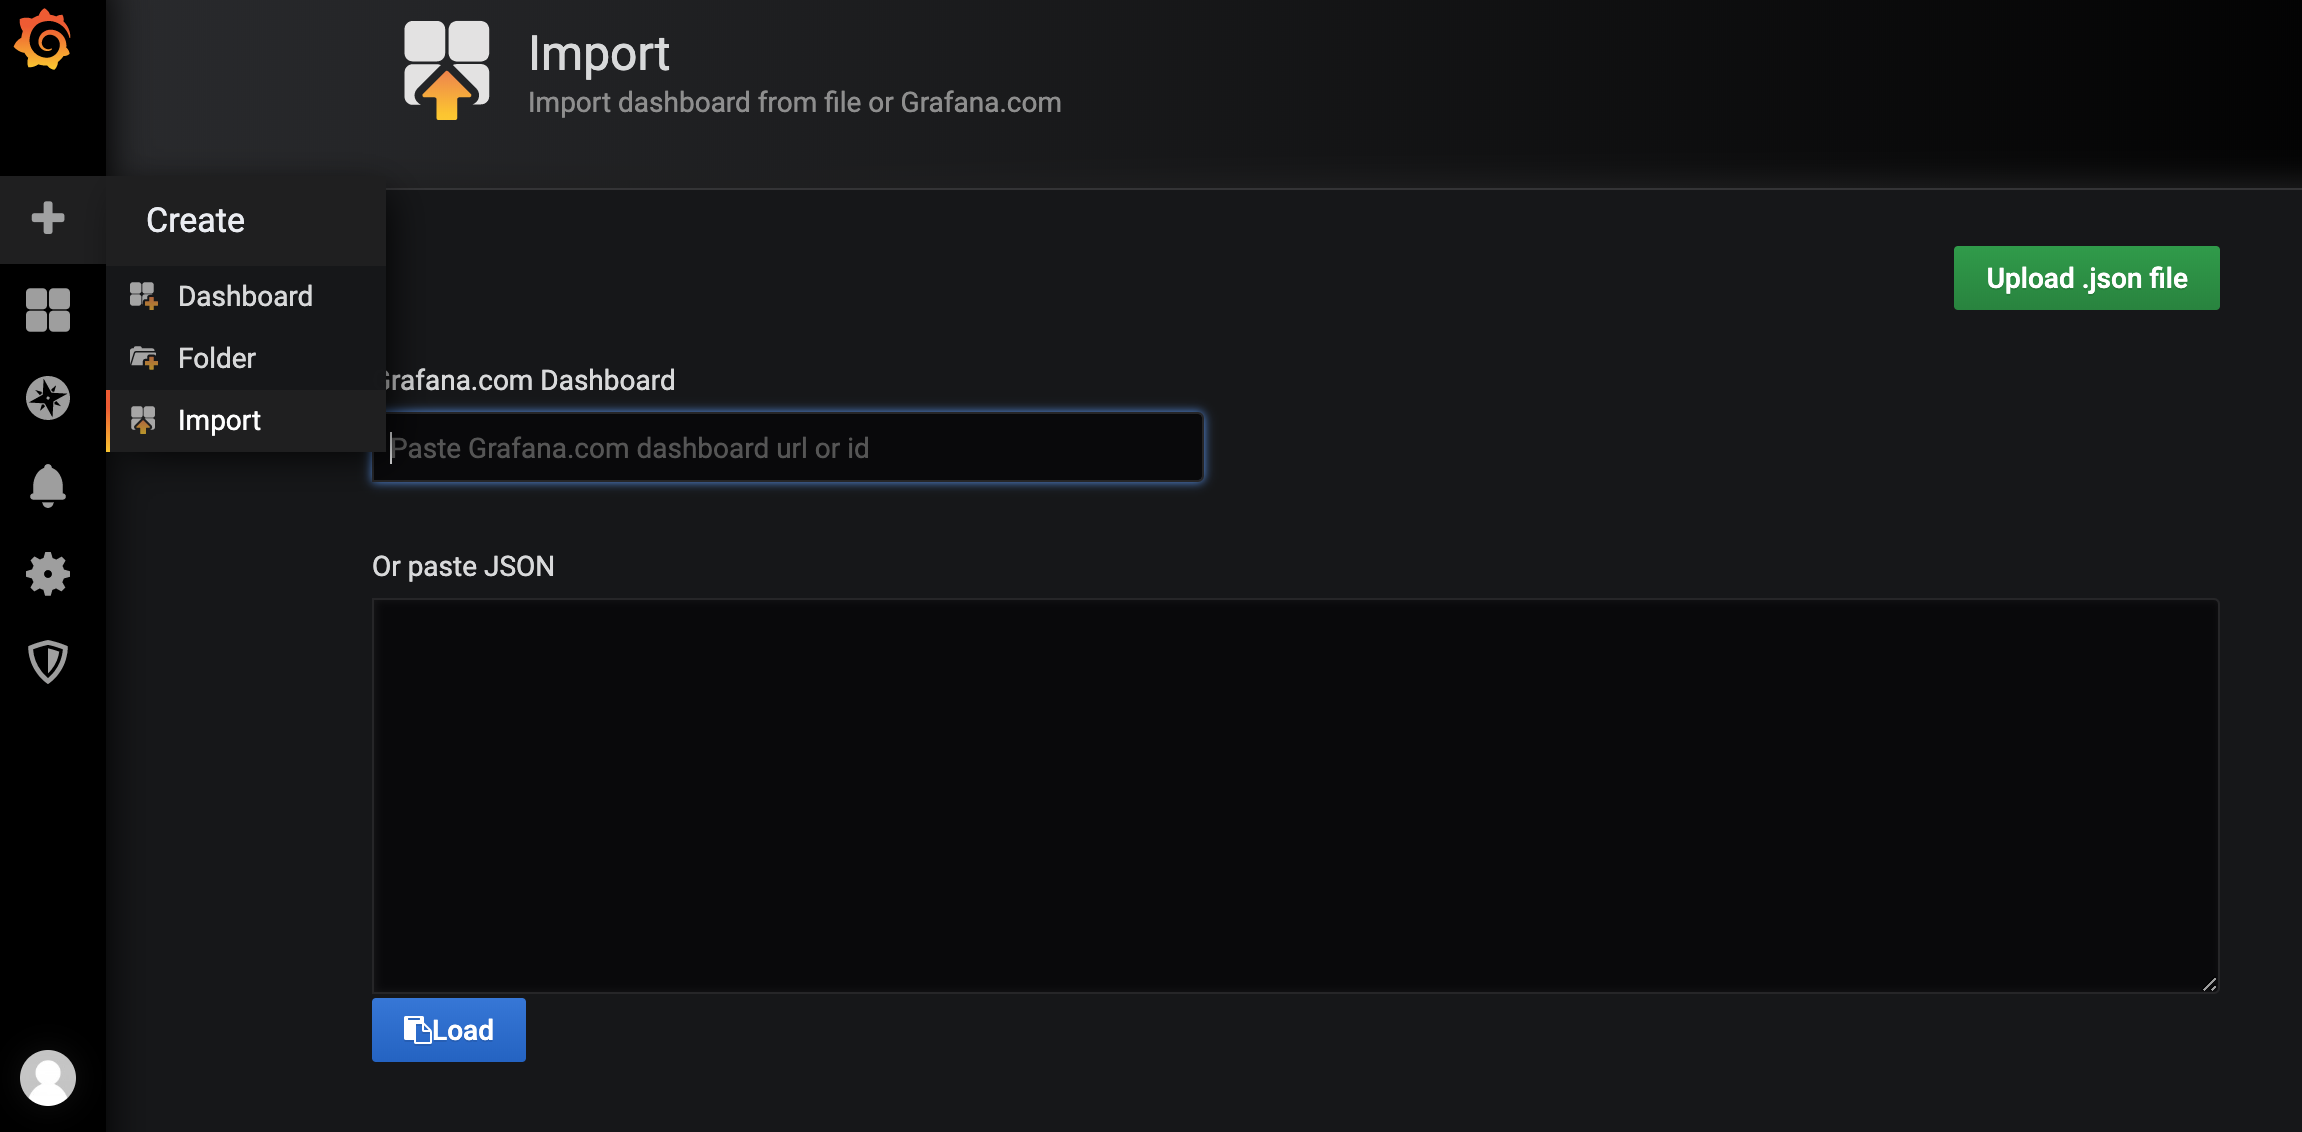
除了自己创建 dashboard,也可以利用别人已完成的 dashborad。
在地址 https://grafana.com/grafana/dashboards 可以看到可以使用的 dashboard。这里我们选择 dashboard id 为 8918 的 dashboard,并导入到 grafana:
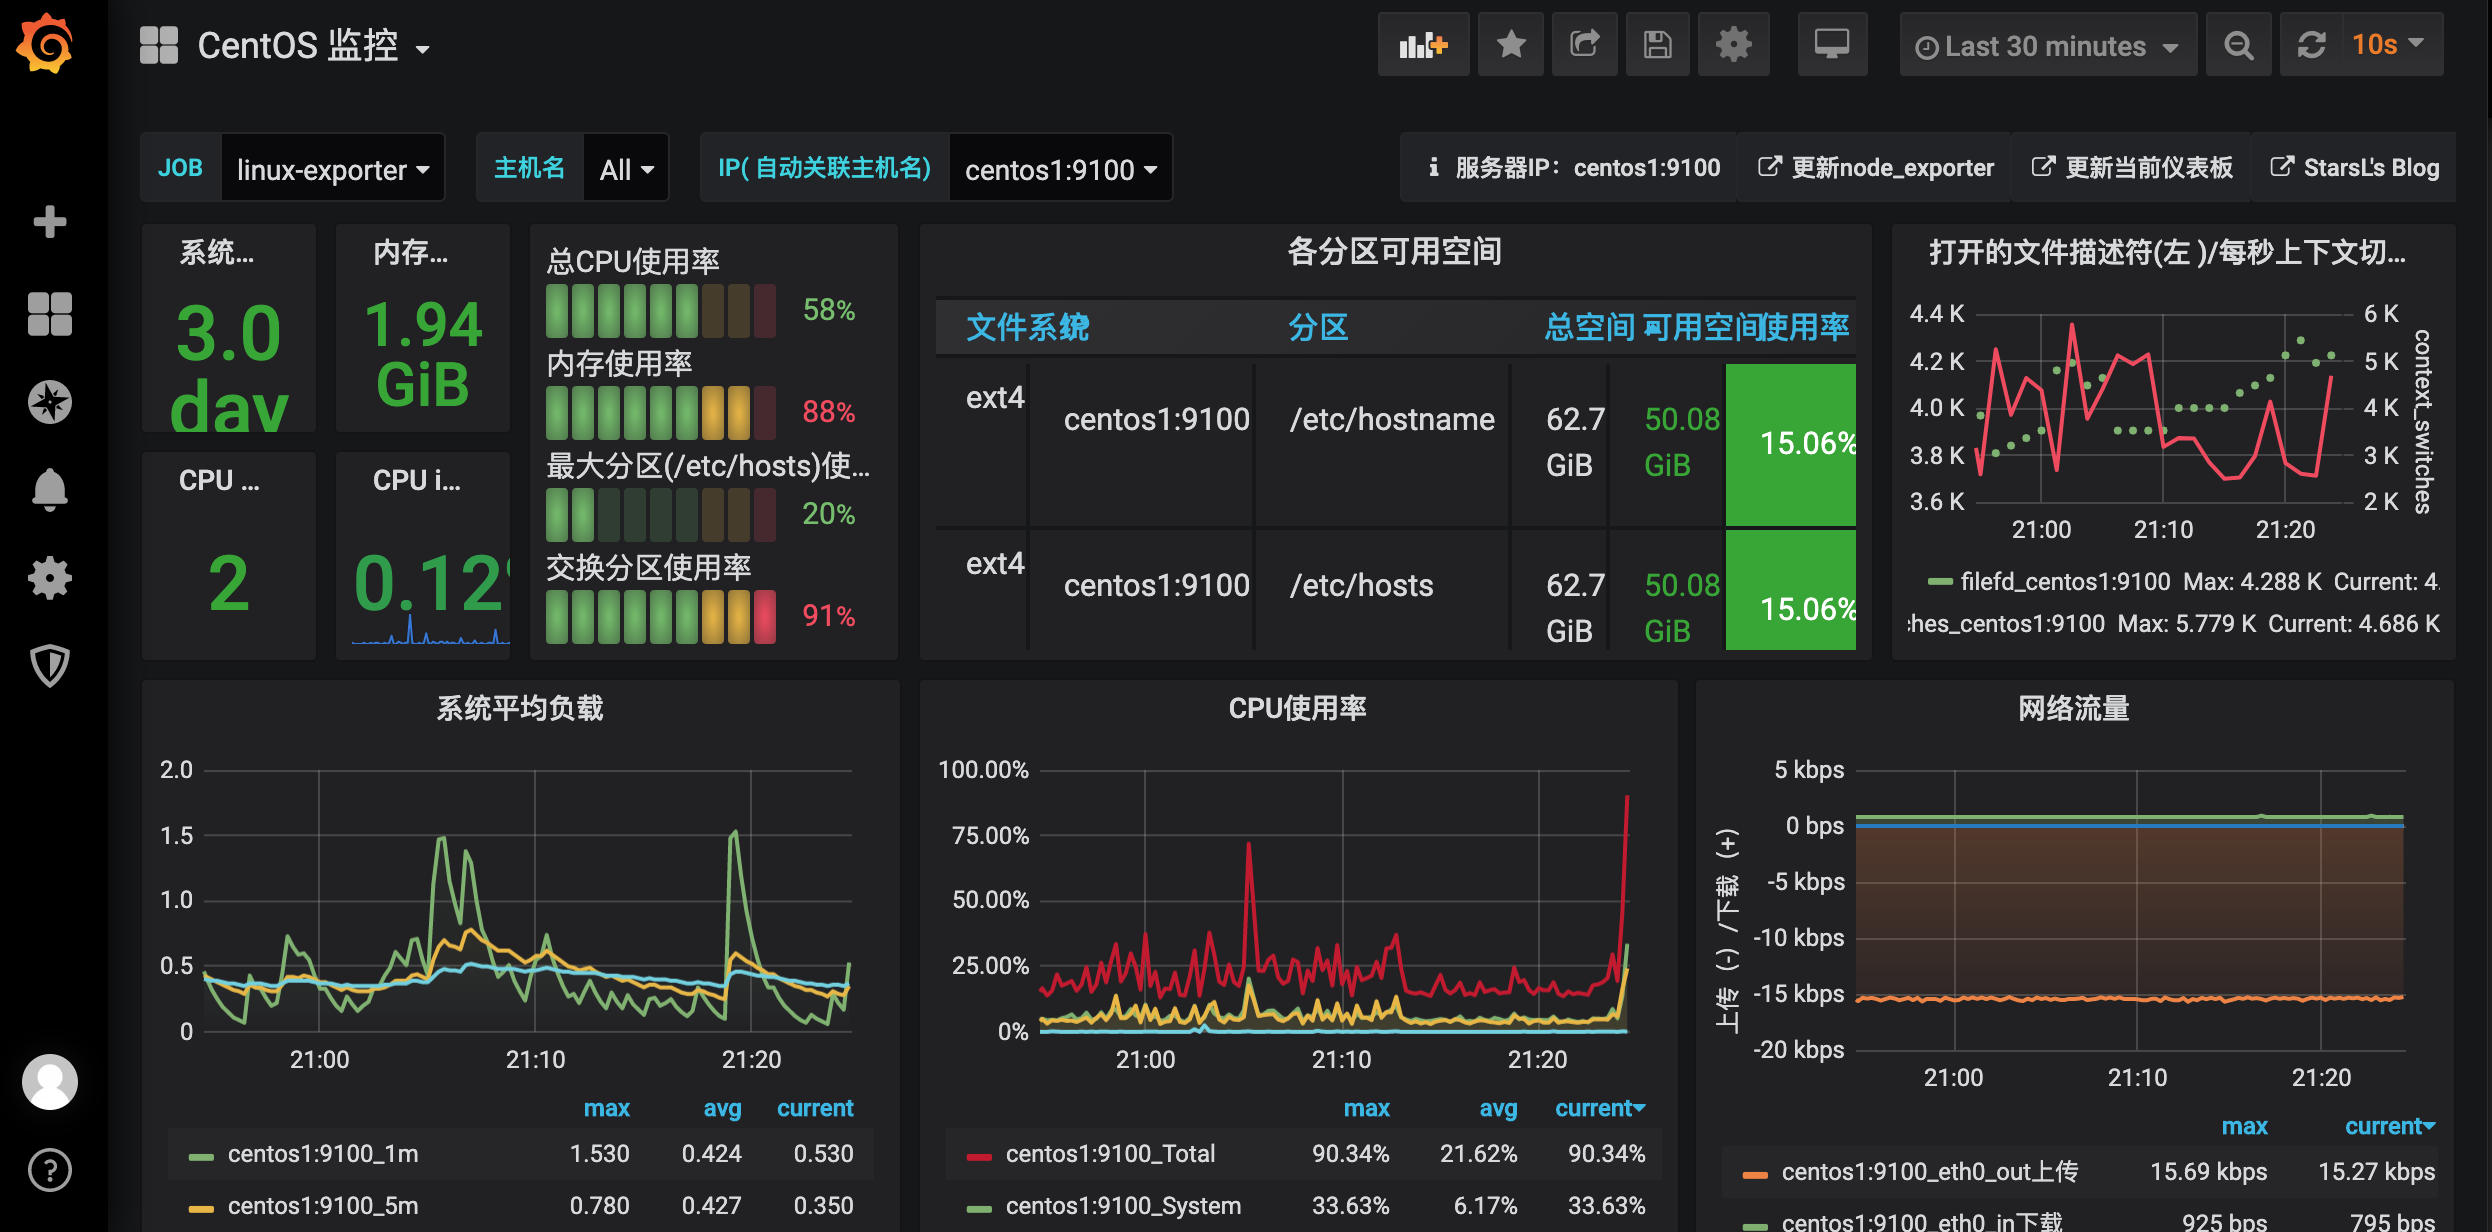
输入 8919,保存后,可以看到显示效果:
参考资料
- https://github.com/prometheus/prometheus
- https://juejin.im/post/5d54bc80f265da03a6531063
- https://www.cnblogs.com/xiao987334176/p/9930517.html
- https://prometheus.io/docs/prometheus/latest/installation/
- https://github.com/vegasbrianc/prometheus/blob/master/docker-compose.yml
- https://juejin.im/post/5c9dc0b06fb9a070ae3da6e7
- https://prometheus.fuckcloudnative.io/di-san-zhang-prometheus/storage
- https://www.ibm.com/developerworks/cn/cloud/library/cl-lo-prometheus-getting-started-and-practice/index.html